
1) What Is Power Quality Analysis?
Power quality (PQ) analysis is the systematic measurement and evaluation of how closely your electrical system aligns with an ideal sinusoidal supply at a stable voltage and frequency. A professional PQ survey quantifies:
- Steady-state parameters: voltage, current, demand, power factor (PF), frequency
- Waveform health: harmonics and THD (Total Harmonic Distortion)
- Events: sags, swells, interruptions, transients, and flicker
- System symmetry: phase unbalance and neutral loading
By monitoring these indicators over time (typically 7–30 days) and across strategic points (utility incomer, main LV board, MCCs, critical feeders), you correlate electrical behavior with operations and identify root causes of trips, overheating, or penalties.
2) Why It Matters: Technical Risks and Business Impact?
Unmanaged PQ issues rarely stay “electrical problems”—they become production, uptime, and cost problems.
- Avoid unplanned downtime: Find the true cause behind drives tripping, UPS transfers, or PLC resets.
- Reduce energy waste: High THD and low PF increase losses; correcting them lowers kWh and heat.
- Prevent utility penalties: Improving PF and mitigating harmonic injection cuts recurring surcharges.
- Extend equipment life: Cleaner waveforms mean cooler transformers, quieter motors, and fewer nuisance trips.
- Support compliance & claims: Evidence from Class-A instruments strengthens utility discussions and warranty cases.
3) Harmonics Explained—In Engineer’s Terms
Modern non-linear loads—VFDs, LED drivers, servers/rectifiers, UPS—draw current in pulses. These pulses add higher-frequency components (3rd, 5th, 7th, 11th…), collectively called harmonics, which distort waveforms and raise THD (Total Harmonic Distortion).
Consequences include:
- Transformer and cable heating (especially from triplen harmonics returning on the neutral)
- Nuisance protection trips and resonance with capacitor banks
- Torque pulsations and additional motor losses
- Misoperation of sensitive electronics
Effective mitigation starts with measurement by harmonic order (not just THD).
Results inform whether to deploy detuned PF correction, passive/active filters, configuration changes, or sequencing.
4) What to Measure—and How to Plan a Survey?
Recommended scope:
- Baseline: PF, demand trend, THD (V/I), voltage unbalance, and frequency stability.
- Events: Sags, swells, interruptions, transients, and flicker.
- Harmonic spectrum: Individual orders and total distortion at incomer and critical feeders.
- Context: Production schedules, major motor starts, chiller/UPS/VFD operations.
Logging duration: Minimum one operating cycle (e.g., one week); ideally a month if loads vary seasonally or shift-wise.
Safety: Use suitable current sensors and safe connection practices for live panels. Always verify phase rotation and wiring before starting the survey.
5) HIOKI Measurement Portfolio—Mapped to Real-World Use Cases
General Tech Services supplies and supports a comprehensive HIOKI toolkit. The right instrument depends on depth of analysis, accuracy class, and number of points to cover.
A) Advanced Troubleshooting & Compliance
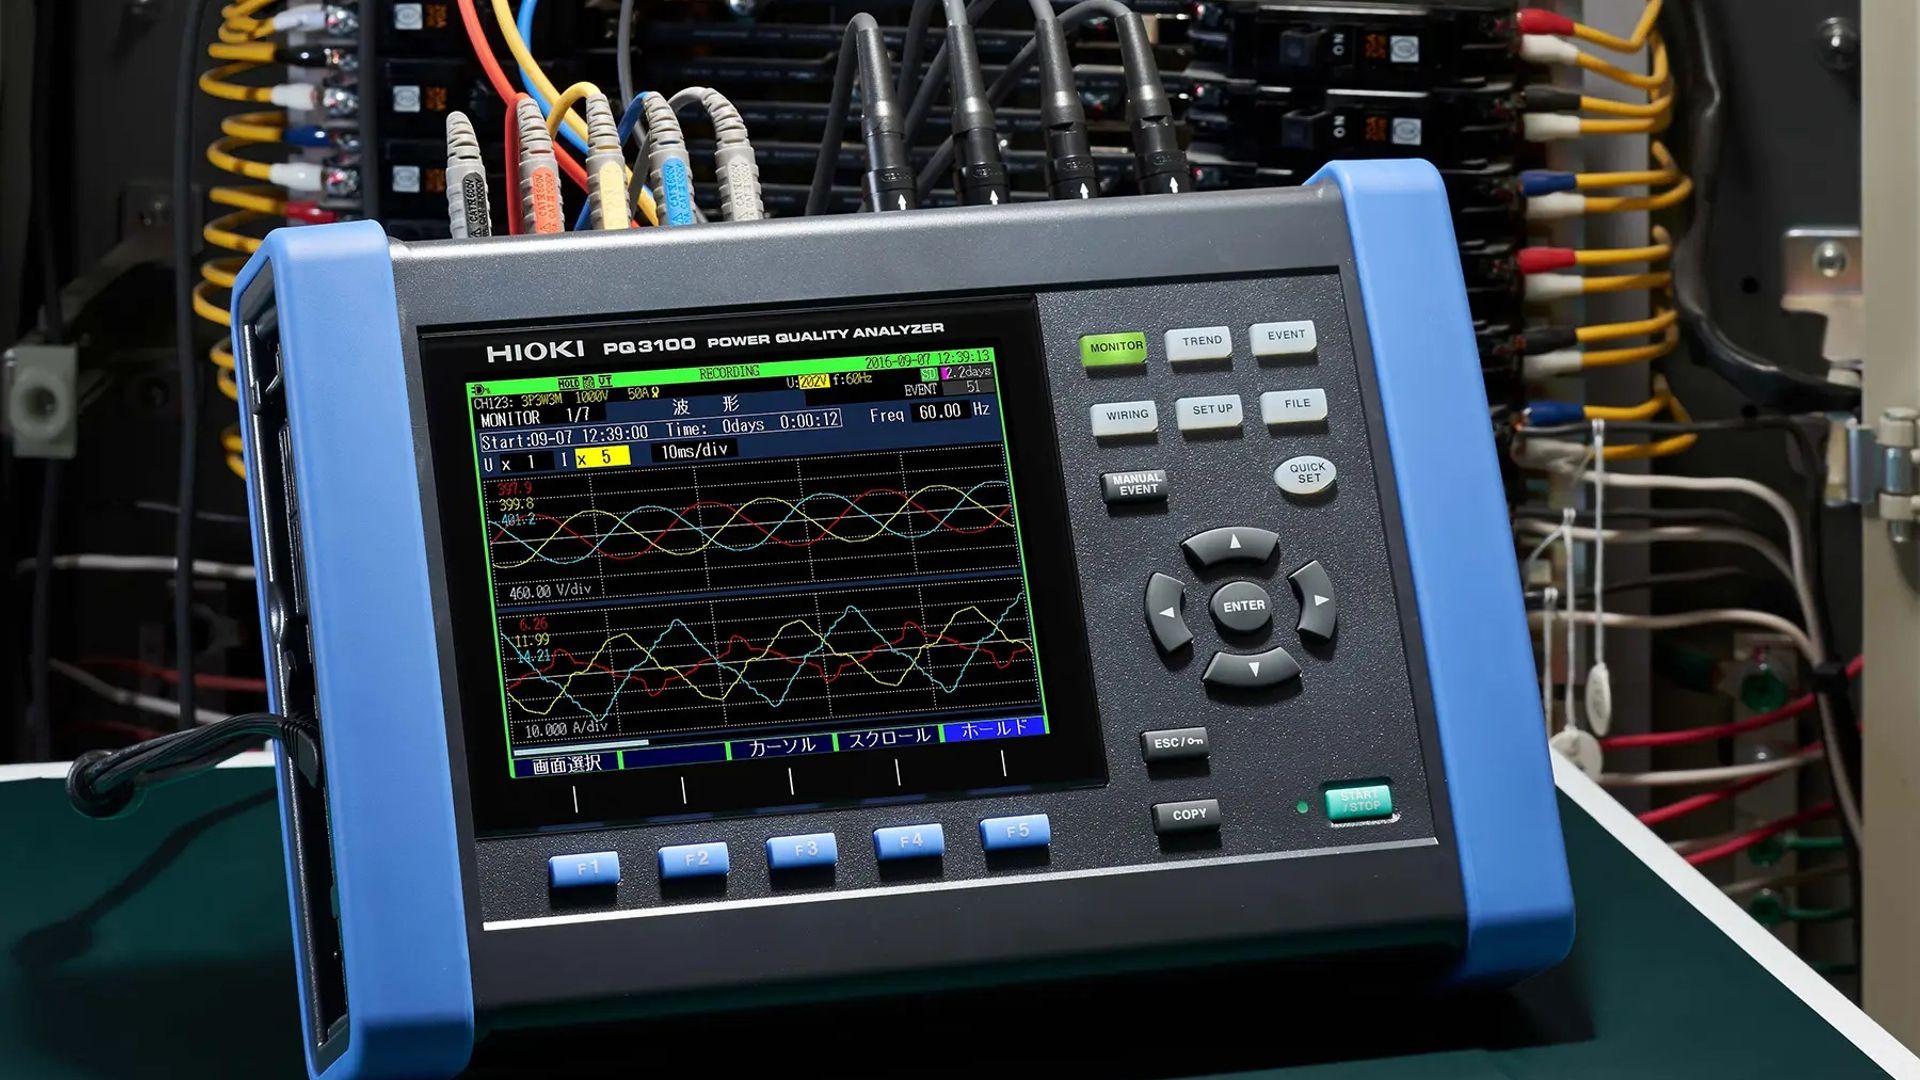
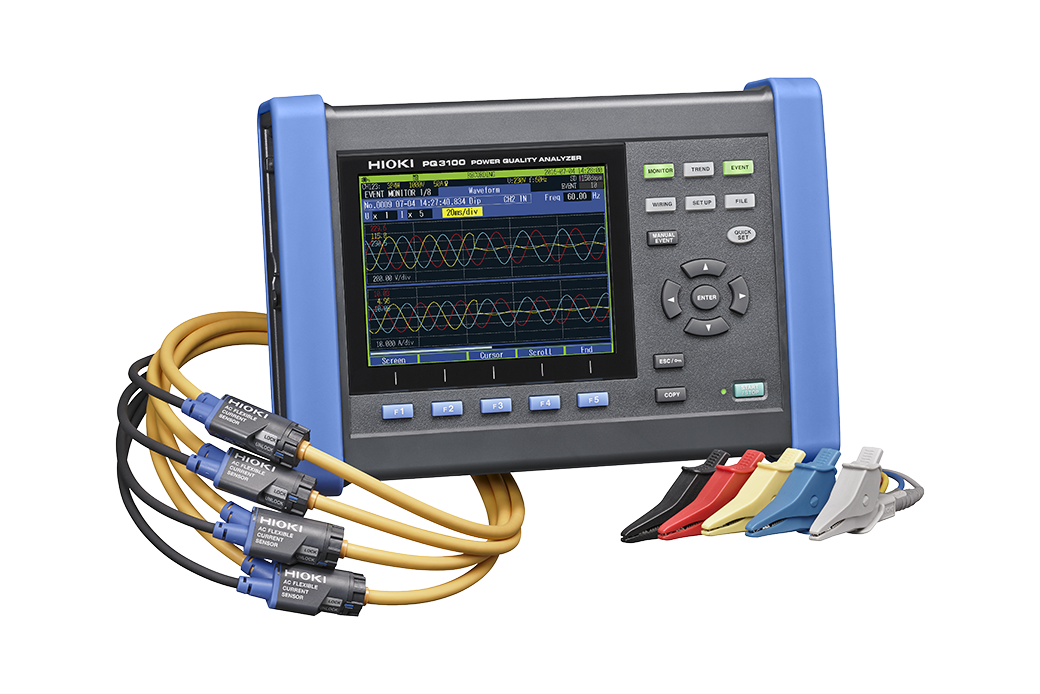
HIOKI PQ3198 – Power Quality Analyzer (Class-A)
- High-confidence capture of events (sags, swells, transients), harmonics, flicker, and unbalance
- Ideal for root-cause analysis and post-mitigation verification
- Pairs with flexible current sensors for fast, safe installation
- PC software (e.g., PQOne) streamlines reporting and event correlation
Use when: you need defensible evidence for utility discussions, mystery trips, or commissioning/sign-off.
B) Long-Term Energy & PQ Logging Across Many Panels
HIOKI PQ3100 – Power Quality/Power Logger
- Multi-channel logging for PF trends, demand peaks, THD profiles, and load balance
- Well-suited for before/after studies (e.g., after PF correction or filter installation)
HIOKI PW3360 Series – Compact Power Loggers
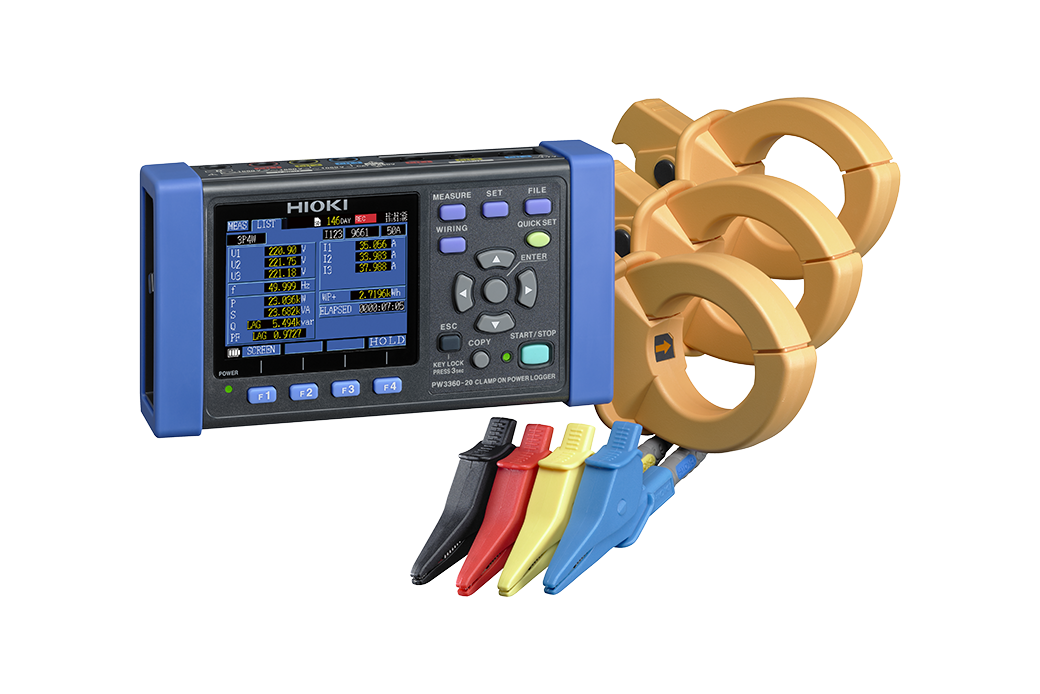
- Lightweight, rapid-deploy loggers for plant-wide screening and multi-point audits
- Excellent for energy optimization programs and tariff penalty reduction
C) Efficiency and Powertrain Testing
HIOKI PW3390 – Precision Power Analyzer
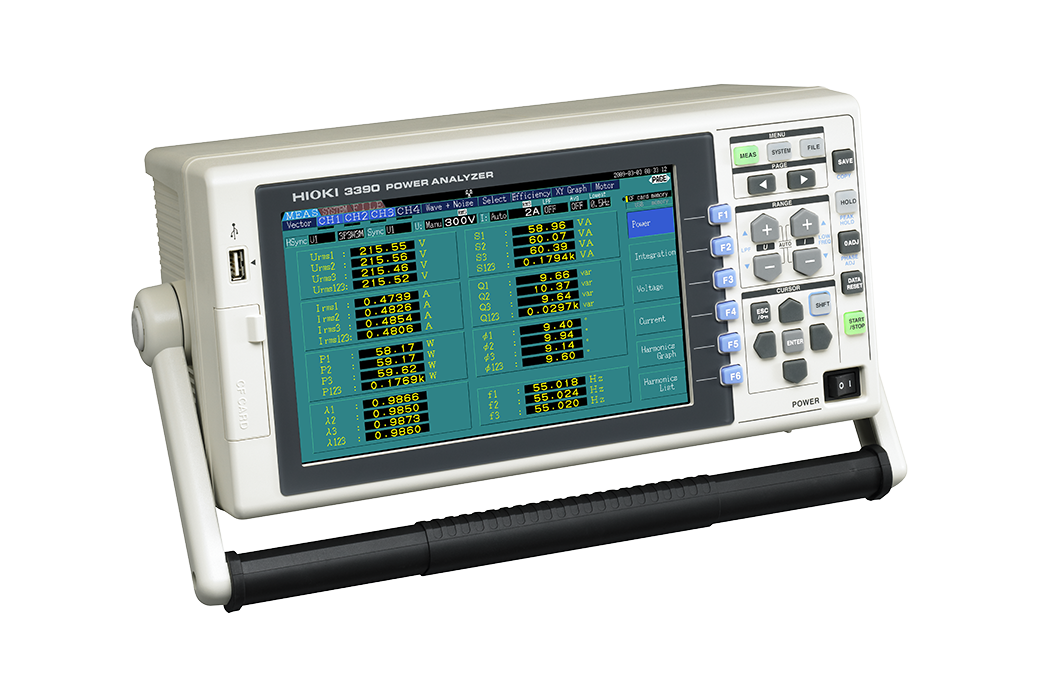
- High-accuracy measurement of inverters, motors, drives, and UPS
- Quantifies input/output power, conversion efficiency, and harmonic content
- Favored by engineering teams validating drive settings and motor loading
D) Fast Screening & Maintenance
HIOKI CM3286 – Power & Harmonics Clamp Meter
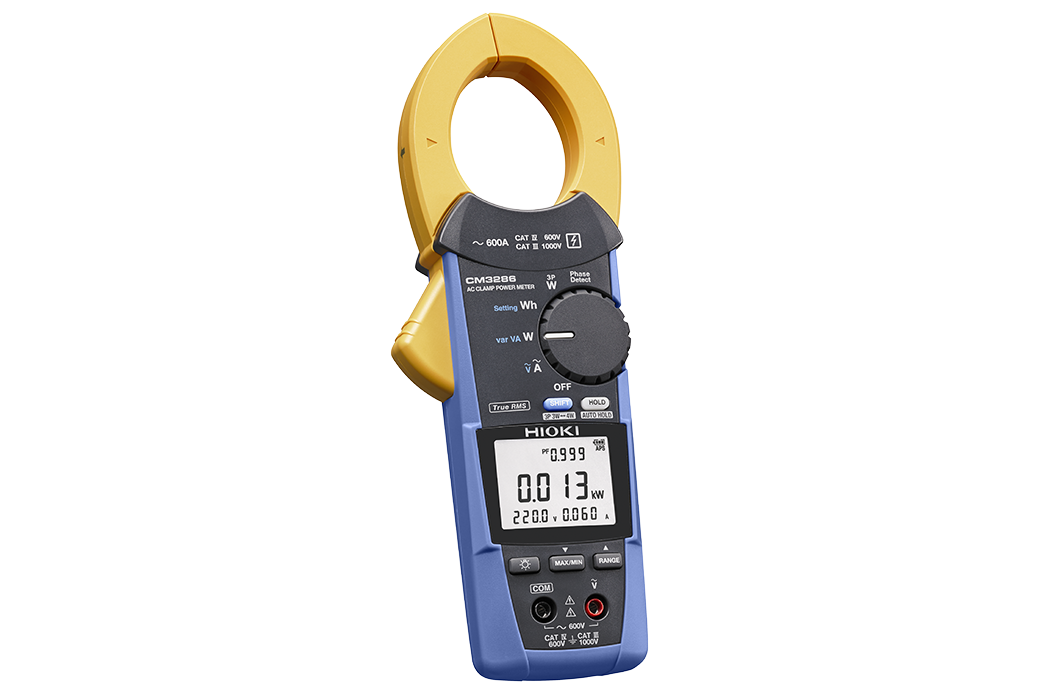
- Quick spot checks of voltage, current, PF, and basic harmonics
- Ideal for maintenance teams to triage panels before deeper logging
E) Sensors, Accessories & Reporting
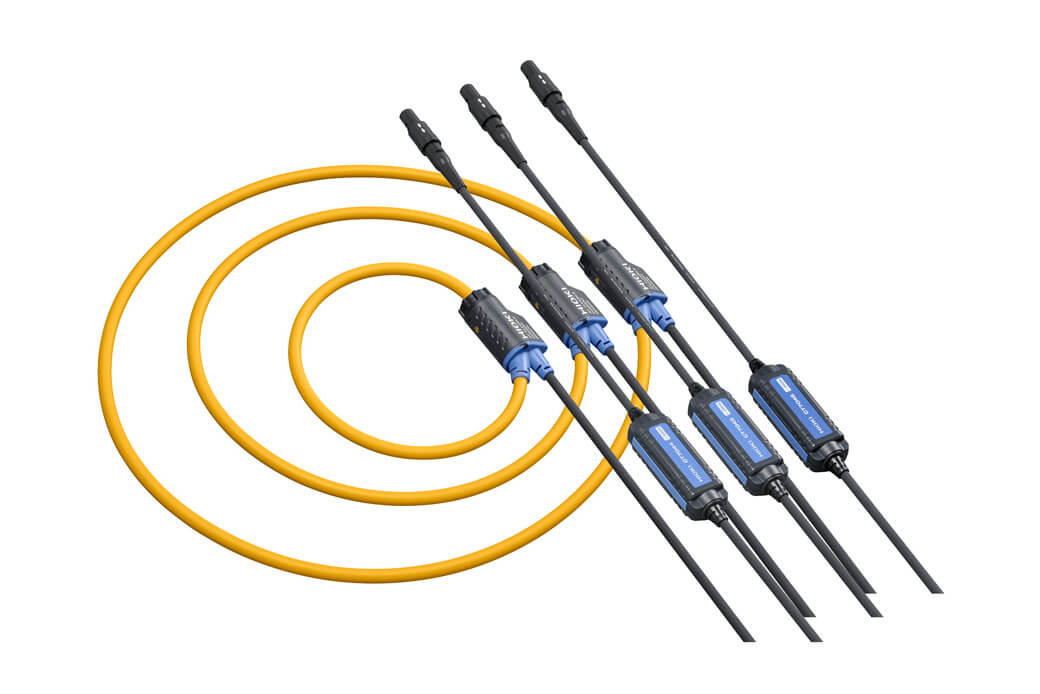
- Flexible current sensors and AC/DC probes: wide ranges, easy on busbars and tight cabinets
- Software (e.g., PQOne / GENNECT): automated event lists, harmonic charts, summary dashboards, and export to PDF/Excel
6) How General Tech Services Delivers Results ?
As a UAE-based engineering and calibration company, we couple HIOKI hardware with practical field expertise.
Our end-to-end approach:
- Discovery: Define risks (trips, penalties, heating) and set measurement objectives/KPIs.
- Measurement plan: Select points, sensors, safety method statements, and logging duration.
- On-site setup: Safe installation on live systems, phase verification, baseline checks.
- Monitoring & handover: Remote/periodic reviews to ensure data integrity.
- Analysis & reporting: Clear findings with harmonic order plots, event timelines, PF/demand trends, and quantified impacts.
- Action plan: Prioritized mitigations (filtering, detuning, wiring/grounding changes, sequencing).
- Verification logging: Post-fix measurement to demonstrate improvement.
Calibration you can trust: We provide ISO-traceable calibration for analyzers, loggers, and sensors—essential for audits, compliance submissions, and repeatability across annual surveys.
Commercial options: Purchase, rental, and rent-to-own programs—plus operator training and report templates for internal stakeholders.
7) Examples of some case studies executed:
Case Study 1 — VFD Packaging Line (Dubai): High Current Distortion and Neutral Loading
What happened
A food & beverage facility reported repeated VFD trips and elevated motor temperatures on two automated packaging lines shortly after an LED lighting retrofit. Operations staff also noted that trips clustered around shift changes when multiple conveyors restarted.
How it was measured
- Instrumentation & placement: HIOKI PQ3198 (Class-A) connected at the MCC incomer to capture system-wide events and waveforms. HIOKI PW3360 loggers installed on two downstream subpanels feeding the packaging lines. HIOKI CM3286 clamp meter used for spot verification of PF, load balance, and basic harmonics. HIOKI CT9667 flexible current sensors applied around busbars and feeders to measure phase and neutral currents.
- Setup assurance: Phase rotation verified; wiring diagrams recorded; screenshots taken of scaling factors and connection schemes (3P4W).
- Logging window: 7 consecutive days to include normal production, shift changes, and cleaning cycles.
- Parameters recorded: Voltage/current waveforms, harmonic spectrum by order, THD (V & I), event capture (sags/swells), neutral current, PF, and demand.
What the instruments recorded
- Current THD (THDi) peaks of ~37–41% on two feeders during shift-change restarts.
- Persistent low-order content with dominant 3rd, 5th, and 7th harmonics.
- Neutral current measured at ~95–110% of phase current during periods when LED lighting ramped up alongside conveyor starts.
- Voltage THD (THDv) at the MCC remained ≤4% during the study.
- Multiple short voltage sags were time-aligned with the simultaneous starting of several drives.
Documented outputs to the client
Event ledger (time-stamped sags/swells), harmonic order plots per feeder and neutral, 7-day THD and PF trend charts, instrument setup records, and calibration certificates.
Case Study 2 — Hospital Imaging Wing (Abu Dhabi): Short-Duration Sags and UPS Transfers
What happened
A private hospital experienced nuisance UPS transfers and visible flicker in sensitive areas during imaging cycles. Transfers were sporadic, more common during peak outpatient hours, and occasionally coincided with HVAC step changes.
How it was measured
- Instrumentation & placement: HIOKI PQ3198 on the UPS input and output to capture upstream events and downstream ride-through behavior with synchronized waveforms. HIOKI PW3360 loggers on key imaging feeders to trend load profiles and harmonics close to the equipment. CM3286 used for on-floor spot checks of PF and basic harmonic indicators.
- Setup assurance: Time bases synchronized across instruments; UPS event log timestamps collected for correlation; connection schemes verified.
- Logging window: 10 days, covering daytime peaks, night shifts, and scheduled generator tests.
- Parameters recorded: Sags/swells with waveforms, harmonics/THD, flicker indices (Pst/Plt), frequency stability, and time correlation to UPS logs.
What the instruments recorded
- Repeated voltage sags to ~84–87% Un lasting 120–180 ms during imaging load ramp-up and some HVAC steps.
- Flicker indices elevated in short windows coinciding with imaging sequences.
- Current harmonics present on imaging feeders; UPS output remained within commonly referenced steady-state distortion levels during observation.
- No transient overvoltage events exceeded PQ3198’s configured trigger thresholds.
Documented outputs to the client
A synchronized event timeline aligning PQ3198 waveforms with UPS log entries, flicker trend graphs, harmonic trend summaries per feeder, instrument photos/connection notes, and calibration documentation.
Case Study 3 — Commercial Tower (Sharjah): Low PF Windows and Neutral Heating Patterns
What happened
A mixed-use commercial tower reported recurring power factor penalties and elevated temperatures on some neutral conductors. Issues tended to emerge in the evenings when IT tenant areas were busiest.
How it was measured
- Instrumentation & placement: HIOKI PQ3100 installed at the main LV incomer to obtain building-level PF, demand, THD/TDD, and voltage symmetry trends. HIOKI PW3360 loggers deployed on three IT risers/floors to capture local load behavior and harmonic content. CM3286 used for rapid verification of load balance and spot harmonic checks at tenant panels.
- Setup assurance: Connection scheme (3P4W) confirmed; phase labeling and CT orientation verified; logging synchronized to building BMS timestamps.
- Logging window: 30 days to span weekday/weekend patterns and occupancy variability.
- Parameters recorded: PF/demand profiles, THD/TDD, harmonic orders (phase and neutral), neutral current trends, voltage unbalance.
What the instruments recorded
- PF dips to ~0.82–0.86 during evening peaks on multiple days.
- Pronounced 3rd-order current on IT feeders; neutral currents reaching ~80–100% of phase current on selected risers.
- THDv at the incomer remained within typical planning levels over the study period.
- Temperature alerts from facility sensors aligned with periods of higher triplen components and neutral current.
Documented outputs to the client
A 30-day PF and demand dashboard, floor-wise harmonic order distributions with neutral overlays, riser comparison summaries, instrument setup records (photos/diagrams), and calibration certificates.
8) Selecting the Right HIOKI Instrument—Quick Guide
- Need Class-A event capture & compliance evidence? → PQ3198
- Plant-wide PF/THD/demand trends and before/after studies? → PQ3100 or PW3360 Series
- R&D or efficiency on drives/UPS/motors? → PW3390
- Rapid screening and maintenance checks? → CM3286
- Unsure? Start with a PW3360 screen; escalate to PQ3198 for deep diagnostics.
9) What You Receive from a General Tech Services PQ Engagement ?
- Scope & safety plan for measurement points and CT selection
- Calibrated HIOKI instrumentation setup and verification screenshots
- Event ledger (sags, swells, transients) with timestamps and severities
- Harmonic order plots (V & I), THD/TDD summaries, neutral currents
- PF & demand trendlines with tariff impact estimates
- Root-cause analysis and ranked mitigation actions (+ expected effect)
- Post-mitigation verification to confirm improvements
10) Frequently Asked Questions
How long should we log?
At least one complete operating cycle (≥7 days). Extend to 30 days if loads vary significantly.
Do we always need a Class-A analyzer?
Use PQ3198 for compliance evidence and transient/event capture. For broad screening and PF/THD/demand, PW3360/PQ3100 are efficient.
Why is calibration important?
Accurate, traceable data prevents misdiagnosis and supports utility or warranty negotiations. General Tech Services provides ISO-traceable calibration and annual service plans.
Can you support rental and turnkey studies?
Yes—short-term rentals, turnkey installation, data analysis, recommendations, and verification logging.